The applications for compressed air generation and distribution are wide and varied. The most important however is the conservation of quality, the reduction in cost and the elimination of leaks.
The uses for generating and distributing compressed gas is diverse and extensive ranging from Food and Bev industry, calibration labs to Underwater Noise Protection / Bubble Curtains.
The primary focus while looking at compressed gas systems is to maintain high quality gas, reducing costs and preventing leaks.
By using a power meter on the supply power of the compressor, a flowmeter that is suitable for wet Air like the VD500 flow sensor after the compressor and a flow meter after the dryer (The VA500 flow meter) you can measure the efficiency of your compressors and driers.
The flow and energy consumption can then be logged, analysed and used to maintain efficiency using the DS 500 mobile chart recorder. If energy usage goes up but the flowrate doesn't then this could indicate a leak, blockage or another issue where the device is using more power than required.
The DS 500 can also be used to monitor internal departments ensuring all areas are operating efficiently.
By monitoring leaks using the LD 500 leak detector or other variations you can detect and eliminate the leaks keeping the efficiency of the compressors to a maximum.
Once the leaks have been found and assessed, you can then use the software for logging and generating ISO 50001 documentation.
By Implementing regular leak checks, this will help reduce energy costs associated with compressed air. An estimated guide of what can be saved depending on leak rate can be seen below. (Source: Efficiency in compressed air, kWh x £0.28 x 8000 working hours per year).
| Leakage size | Air loss | Energy loss | Approx Cost of leak | |||
| Diameter (mm) | 6 bar (1/s) | 12 bar (1/s) | 6 bar (kWh) | 12 bar (kWh) | 6 bar (£) | 12 bar (£) |
| 1 | 1.2 | 1.8 | 0.3 | 1.0 | £672 | £2240 |
| 3 | 11.1 | 20.8 | 3.1 | 12.7 | £6,944 | £28,448 |
| 5 | 30.9 | 58.5 | 8.3 | 33.7 | £18,592 | £75,488 |
| 10 | 123.8 | 235.2 | 33 | 132 | £73,920 | £295,680 |
Along with the capability of logging the data, you can also upload photos from the LD500 of where the leak is, allowing for easy relocation for when the repair can be completed.
By monitoring the quality of your compressed air you are also able to identify issues and maintain standards to ISO 8573-1.
To achieve the ISO 8573-1 standards the dew point, oil residue and particles need to be monitored.
Depending on the compressor, the drier and tanks used depends on what level of ISO 8753-1 that can be achieved.
Below is a breakdown of what is required to meet the varying levels:
Certain applications and industries require the higher levels of ISO. For an example, in the pharma industry, when transporting raw ingredients using air, they need low moisture/oil and particulate content to prevent clumping/contamination and maintain consistency between batches.
This information and instrumentation can also be used in conjunction with the data logger, so if an issue where to arise you can spot what has been affected and if it was due to a change in oil, moisture or particulates.
If continuous monitoring isn't required (due to the applications needs) then a mobile oil check version is available. A hand held dewpoint sensor is also available, the portable DP 500 dew point sensor.
Mobile dew point metering with data logger. 3.5" touch screen.
Capable of measuring between 0.001 and 2.5 mg/㎥. Monitors compressed air quality to ISO 8573 class 1 standard.
By monitoring all the above parts of the compressed air system and distribution network you can log and track usage for all departments. By using the software with the devices you can also monitor consumption and usage remotely in live time. Different access levels can be assigned, View only or administrator.


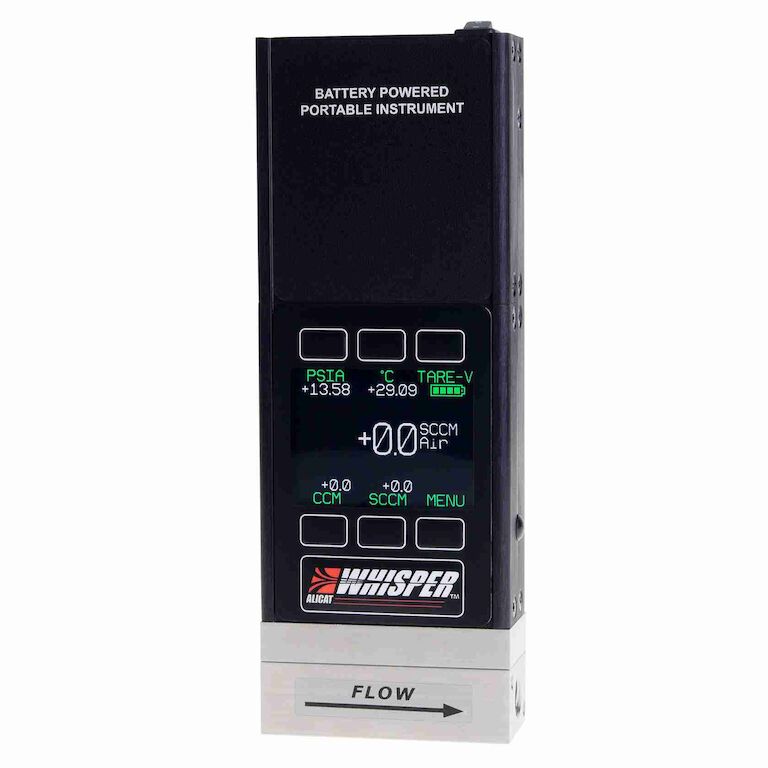 Alicat MB - Portable Gas Mass Flow Meter
 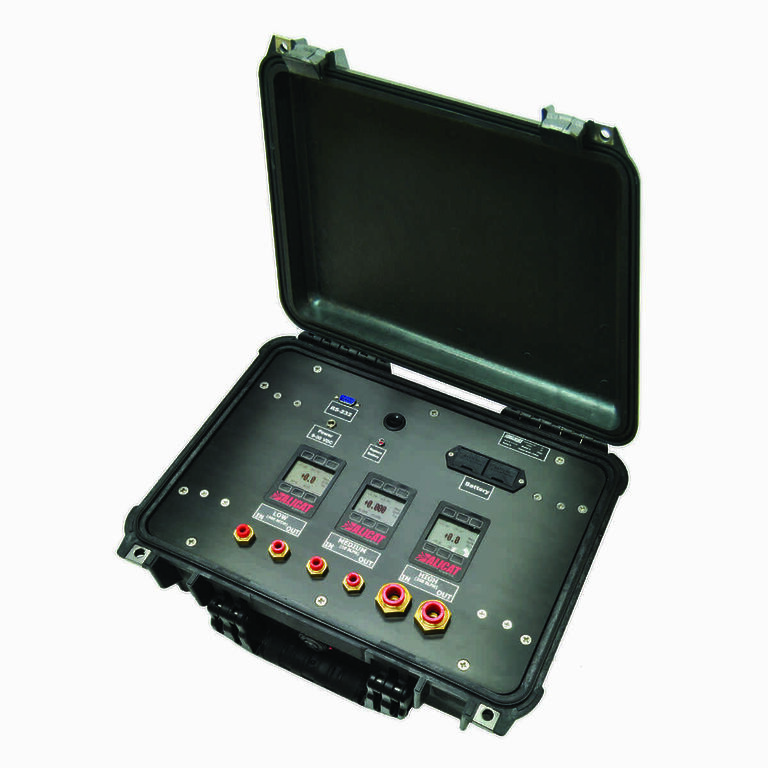 Alicat PCU - Gas Flow Portable Calibration Unit
  King Instruments 7200 Series Rotameter
 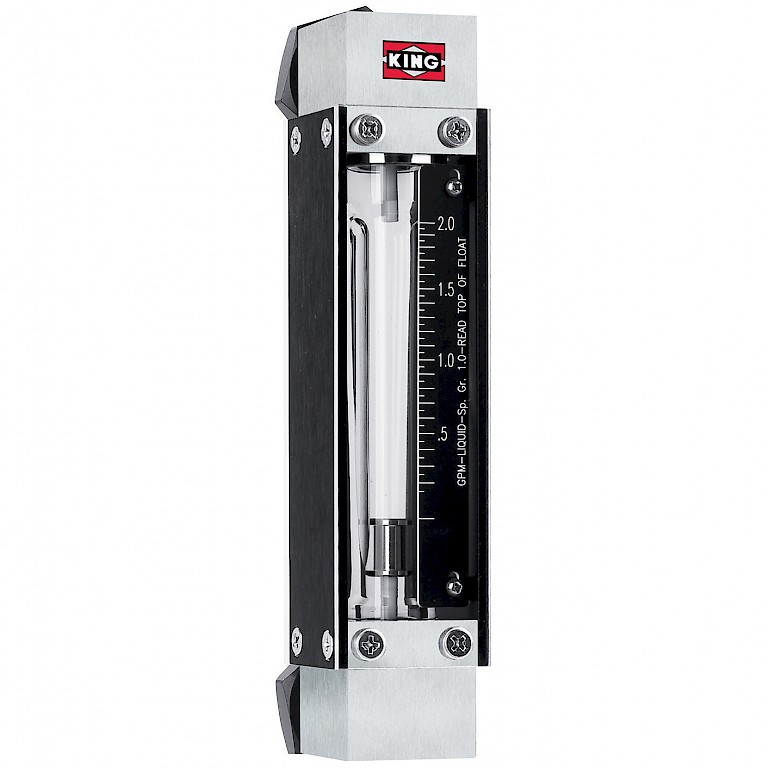 King Instruments 7450 Series Rotameter
 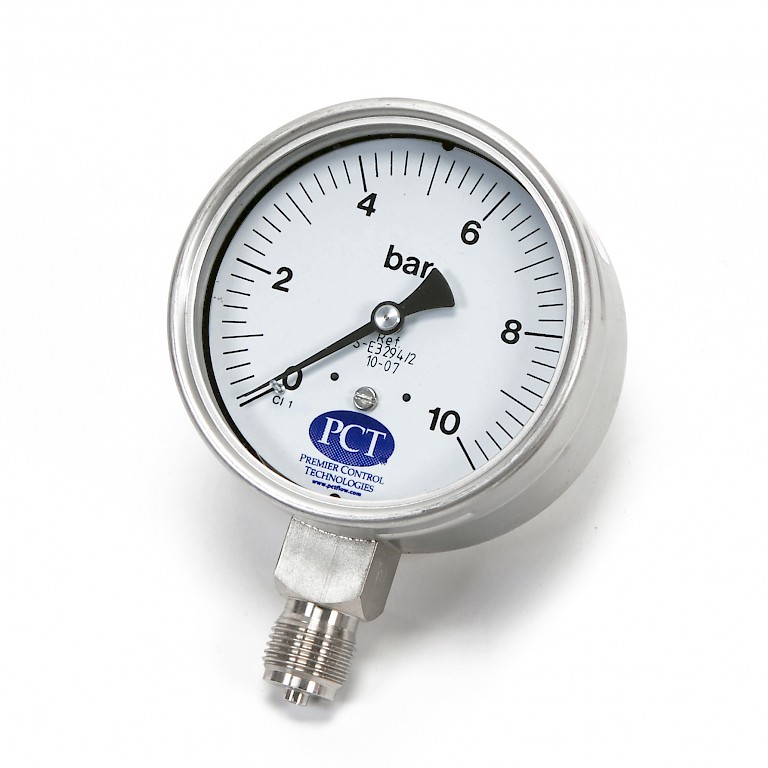 PCT Pressure Gauge
 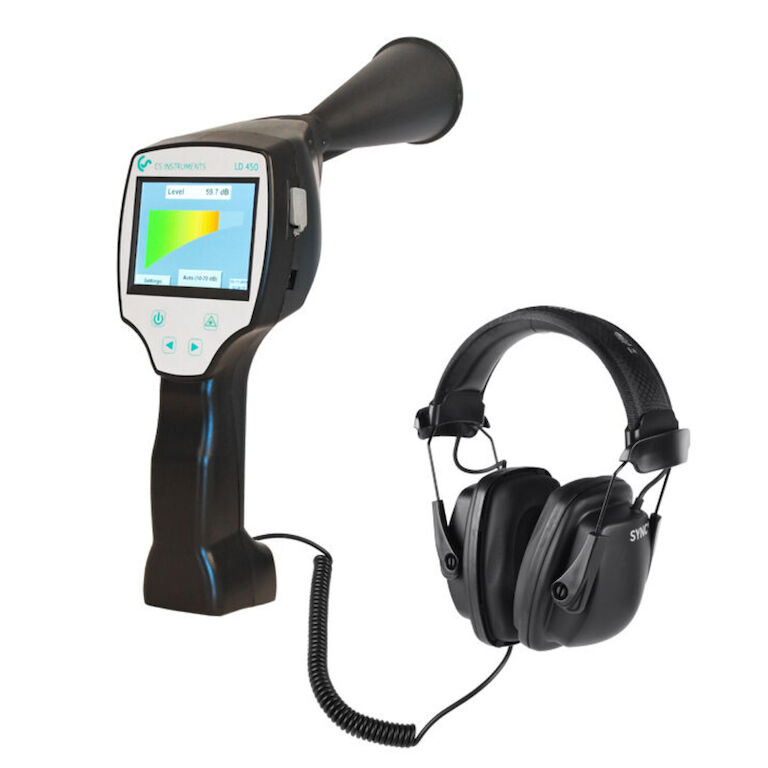 CS Instruments LD 450 - Leak detector
 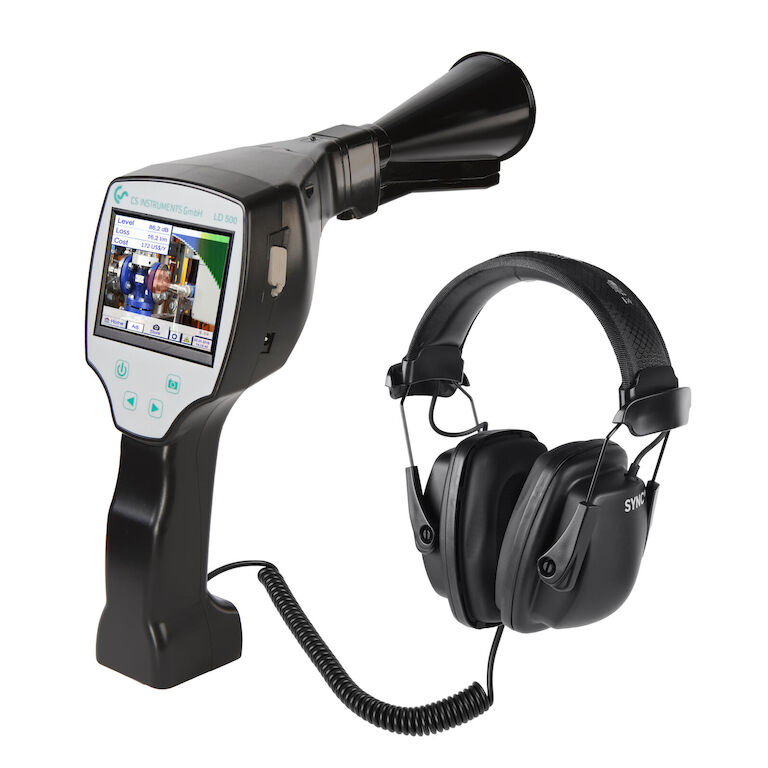 CS Instruments LD 500 / LD 510 - Leak detector with camera
 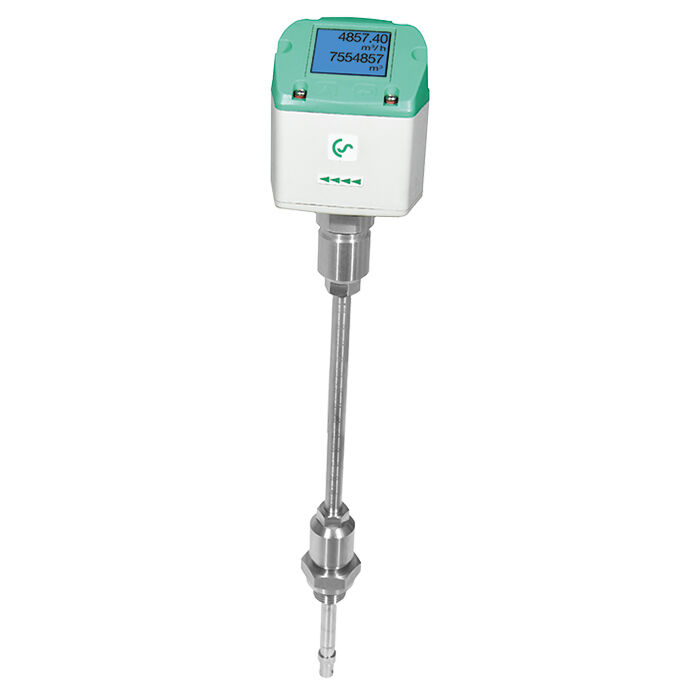 CS Instruments VA 500 - Flow meter for compressed air and gases
 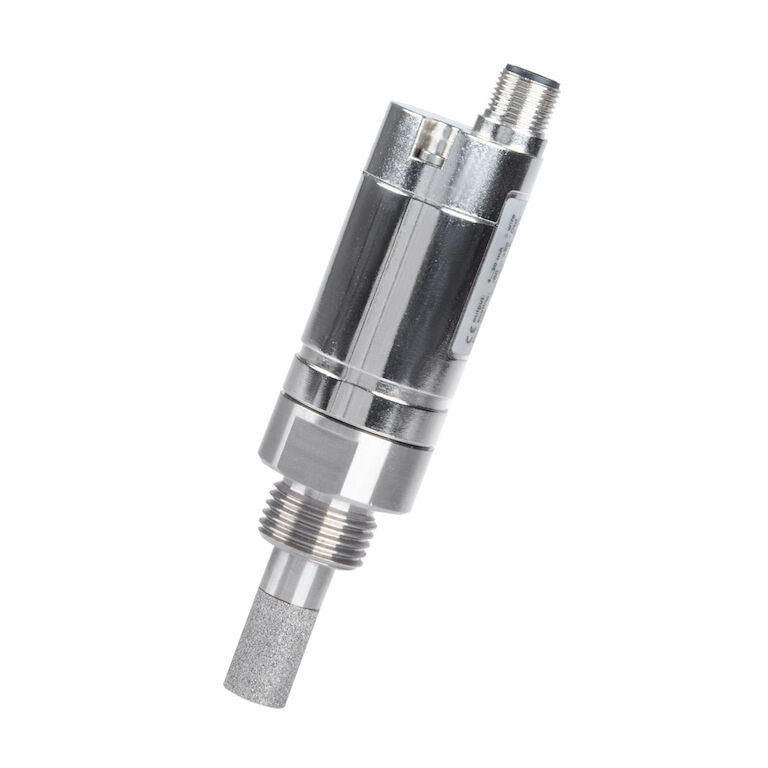 CS Instruments FA 510 / FA 515 Dew Point Sensor
 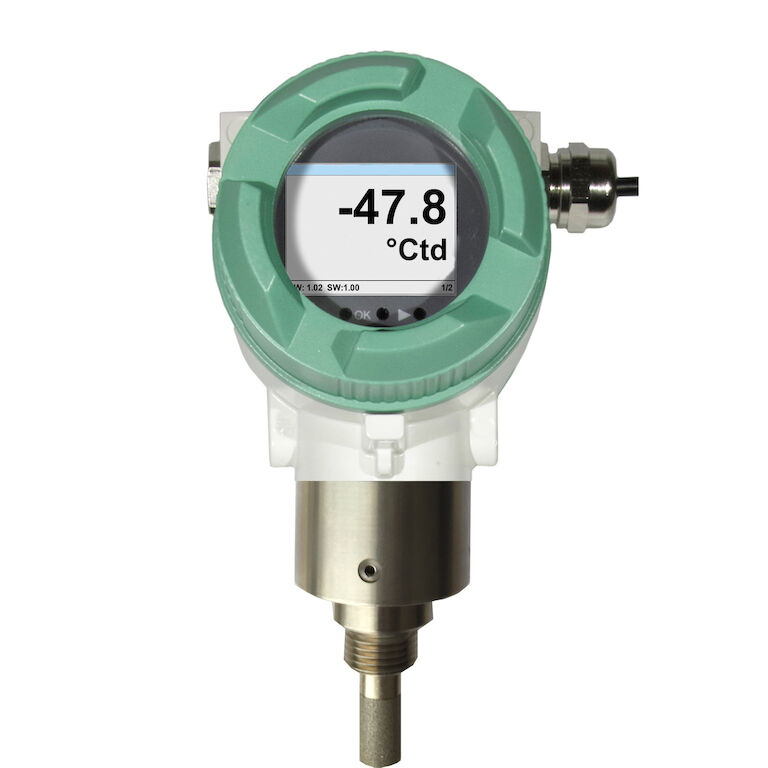 CS Instruments FA 550 Dew Point Sensor
 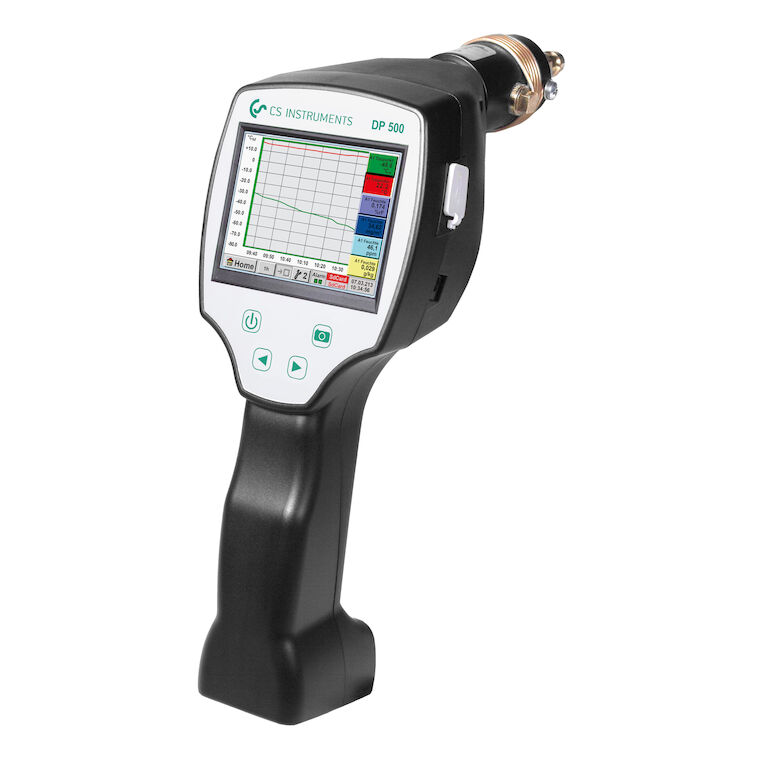 CS Instruments DP 500 / DP 510 Portable dew point meter
 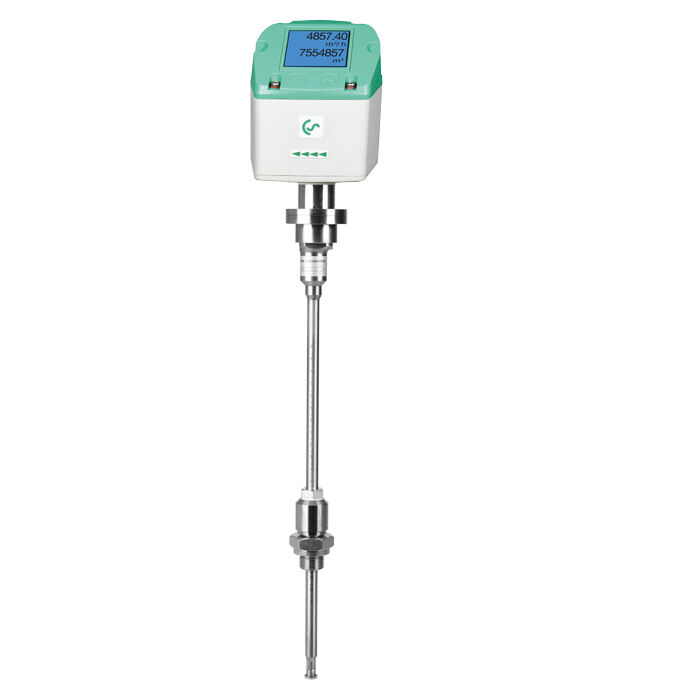 CS Instruments VD 500 flow sensor for wet compressed air and gases
 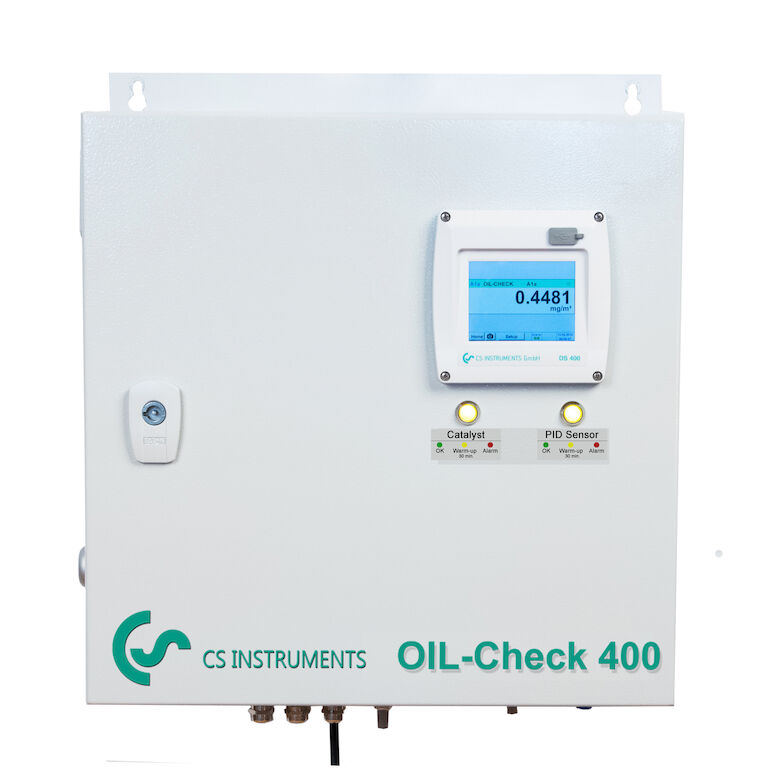 CS Instruments Oil-Check 400 residual oil measurement
 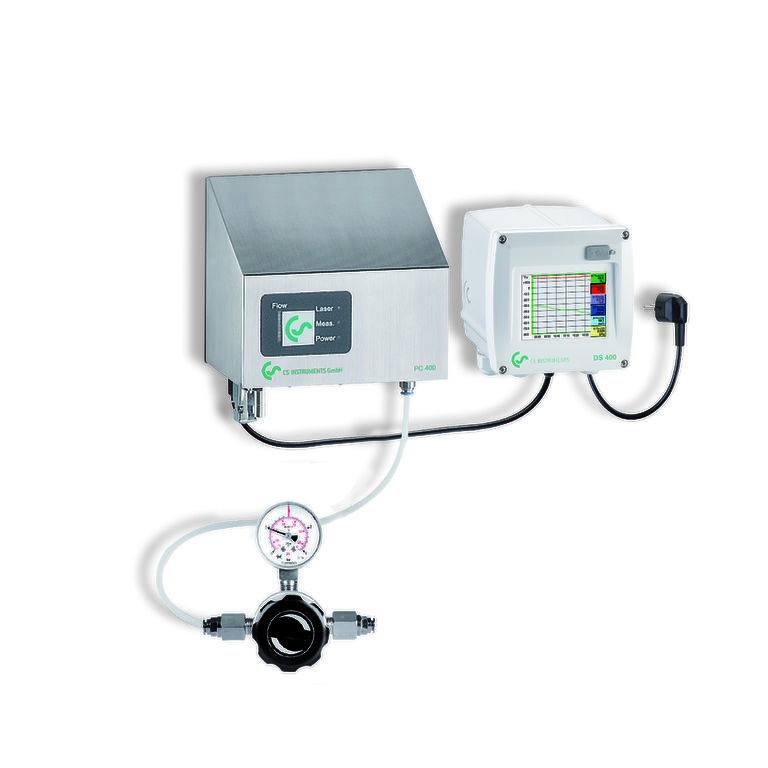 CS Instruments PC 400 Particle counter
 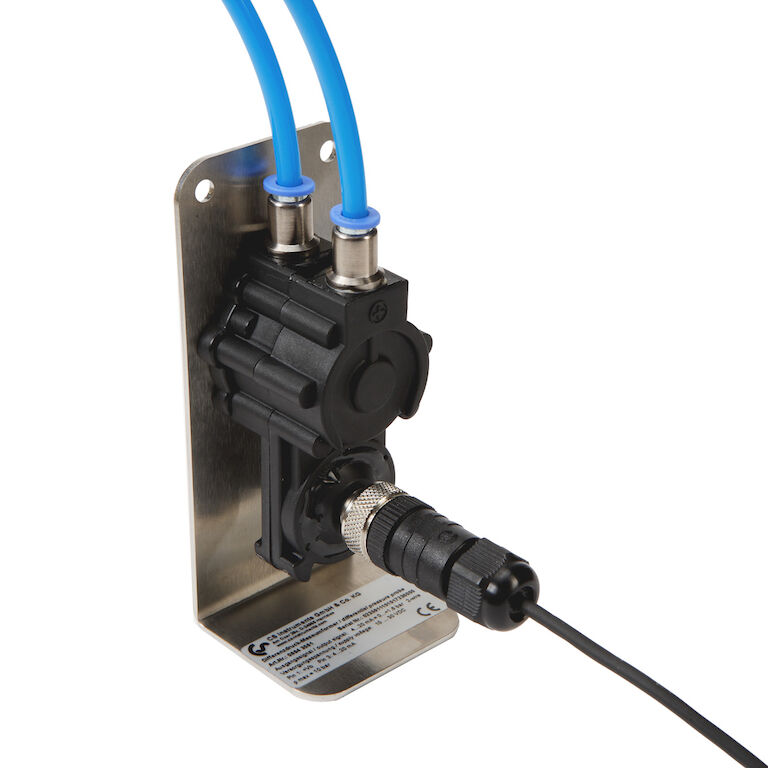 CS Instruments Differential Pressure Probe
 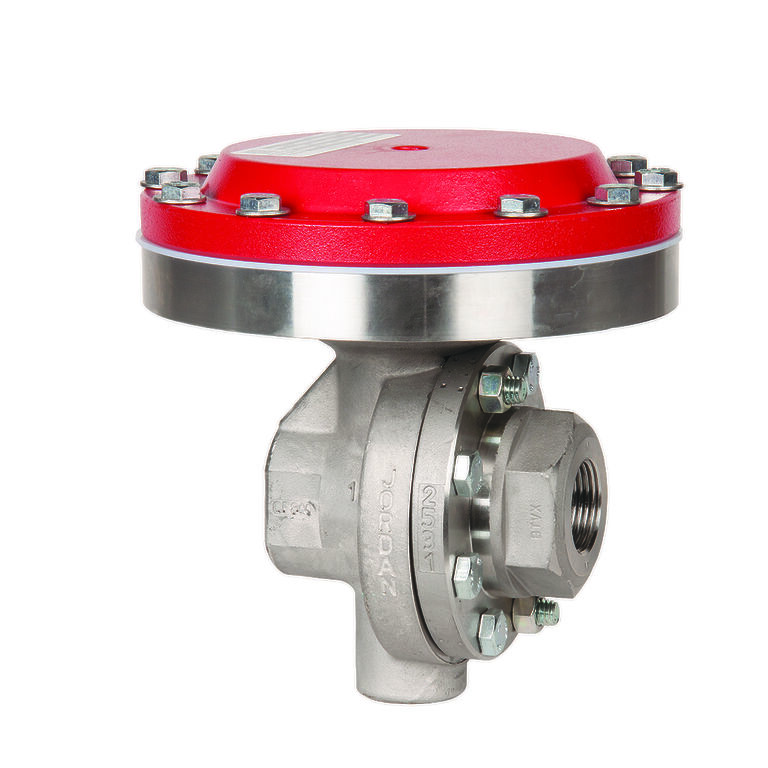 Jordan Valve Mark 56 and Mark 560 Series Air Loaded Back Pressure Regulator
 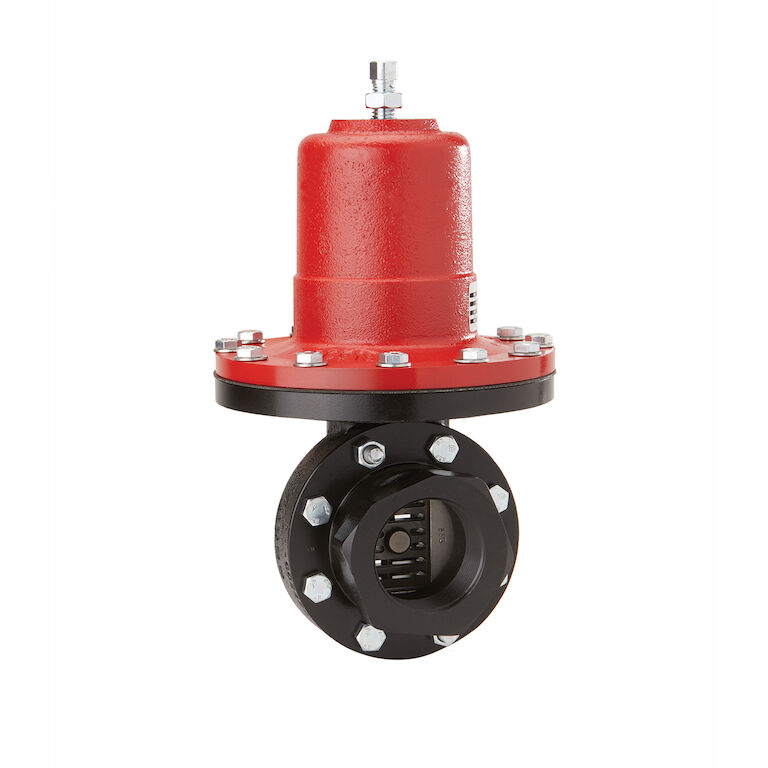 Jordan Valve Mark 601 and Mark 602 Series High Flow Pressure Regulator
 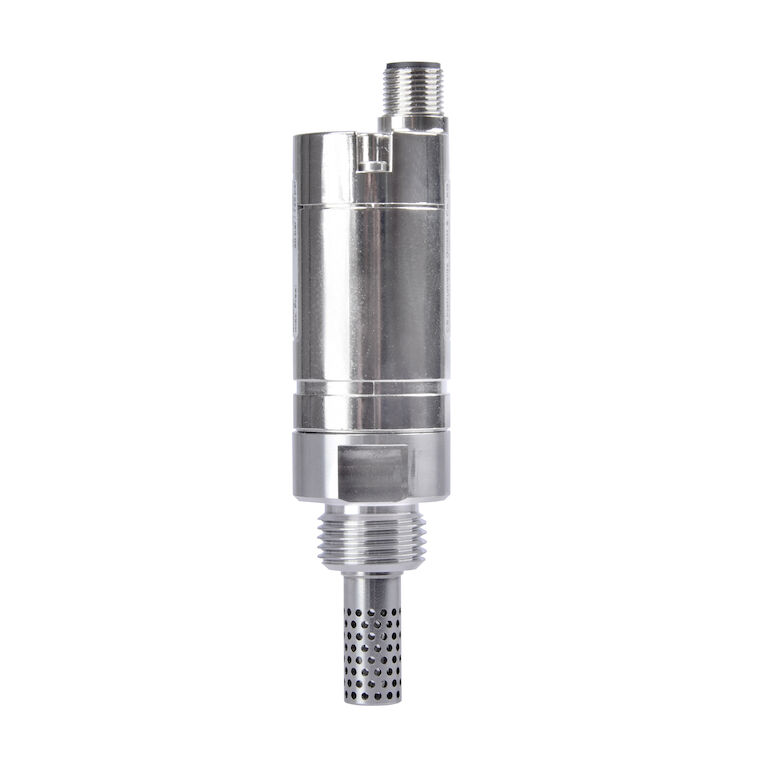 CS Instruments FO510 Oil moisture sensor